|
We are pleased to share our October 2024 Compass Insights including national real estate market data and economic trends with all of you.
If you want deeper data about Seattle or any other US market, please reach out to Trey, Valerie, or Fallon. |
|
|
|
|
Interest rates were rapidly dropping in August and September, with most analysts expecting the decline to continue through the end of the year, but in early October an unexpectedly strong jobs report caused rates to jump back up - though remaining significantly lower than in spring. |
|
|
Inflation has continued to fall, getting closer to the Federal Reserve Bank's target of 2%. Lower inflation makes it more likely that the Fed will continue to reduce its benchmark rate, which should help reduce mortgage interest rates (though there are a number of often volatile factors at play). |
|
|
The S&P 500, illustrated below, and the Dow stock index both recently hit new all-time highs, and the Nasdaq has come very close to doing so. This deeply affects household wealth and economic confidence, especially for affluent households. |
|
|
The national median house sales price has increased by approximately 49% over the last 5 years. Note that seasonal ebbs and flows are common. |
|
|
The U.S. median condo/co-op sales price has seen a similar trend in appreciation. |
|
|
This chart illustrates broad, long-term trends in the number of new listings coming on market - which has rebounded dramatically. Though remaining far below long-term levels, the increase has been altering market dynamics to buyers' benefit. |
|
|
While the number of new listings has increased year-over-year, the number of sales has fallen. Sales volume usually peaks in late spring. |
|
|
More new listings, but less sales has caused the inventory of active listings to rise to its highest count in 4 years: Much higher than in 2023, though the change is less substantial compared to 2021 and 2022. |
|
|
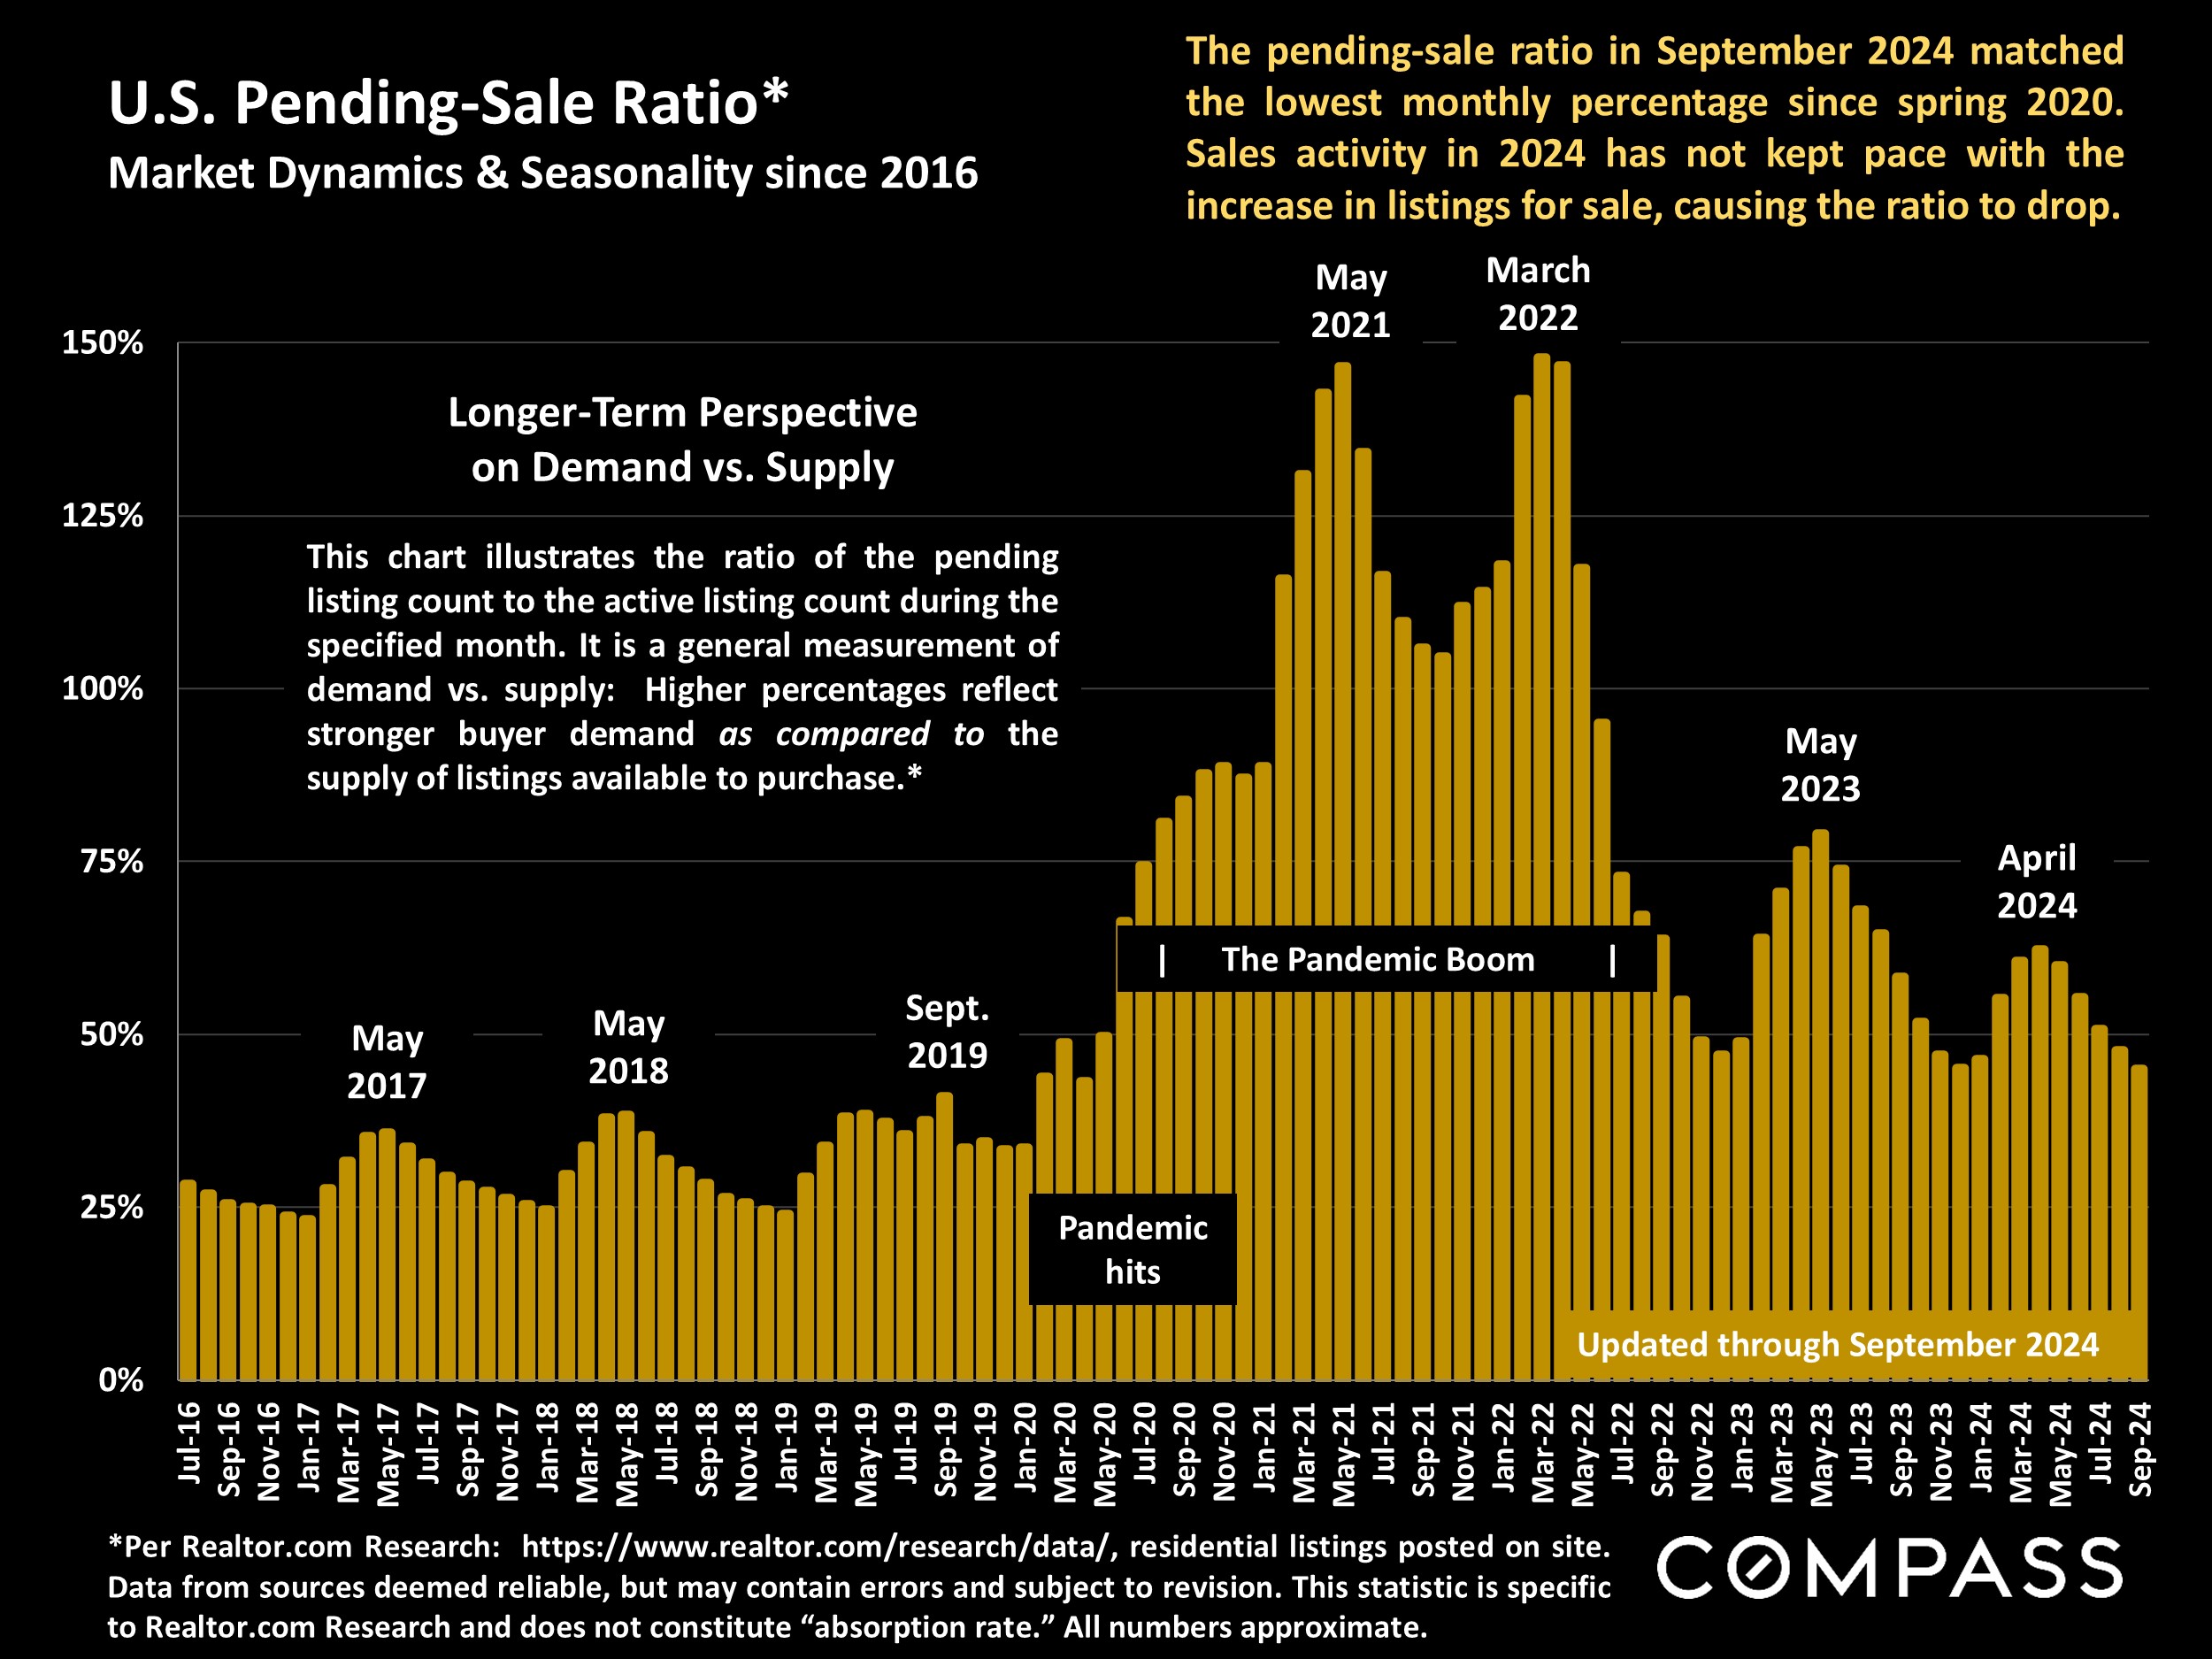
The pending-sale ratio measures demand vs. the supply of listings. The higher the ratio, the more heated and competitive the market. The changes mentioned above have caused the ratio to decline - but note that while the ratio is low compared to recent years, it is not low compared to pre-pandemic norms. |
|
|
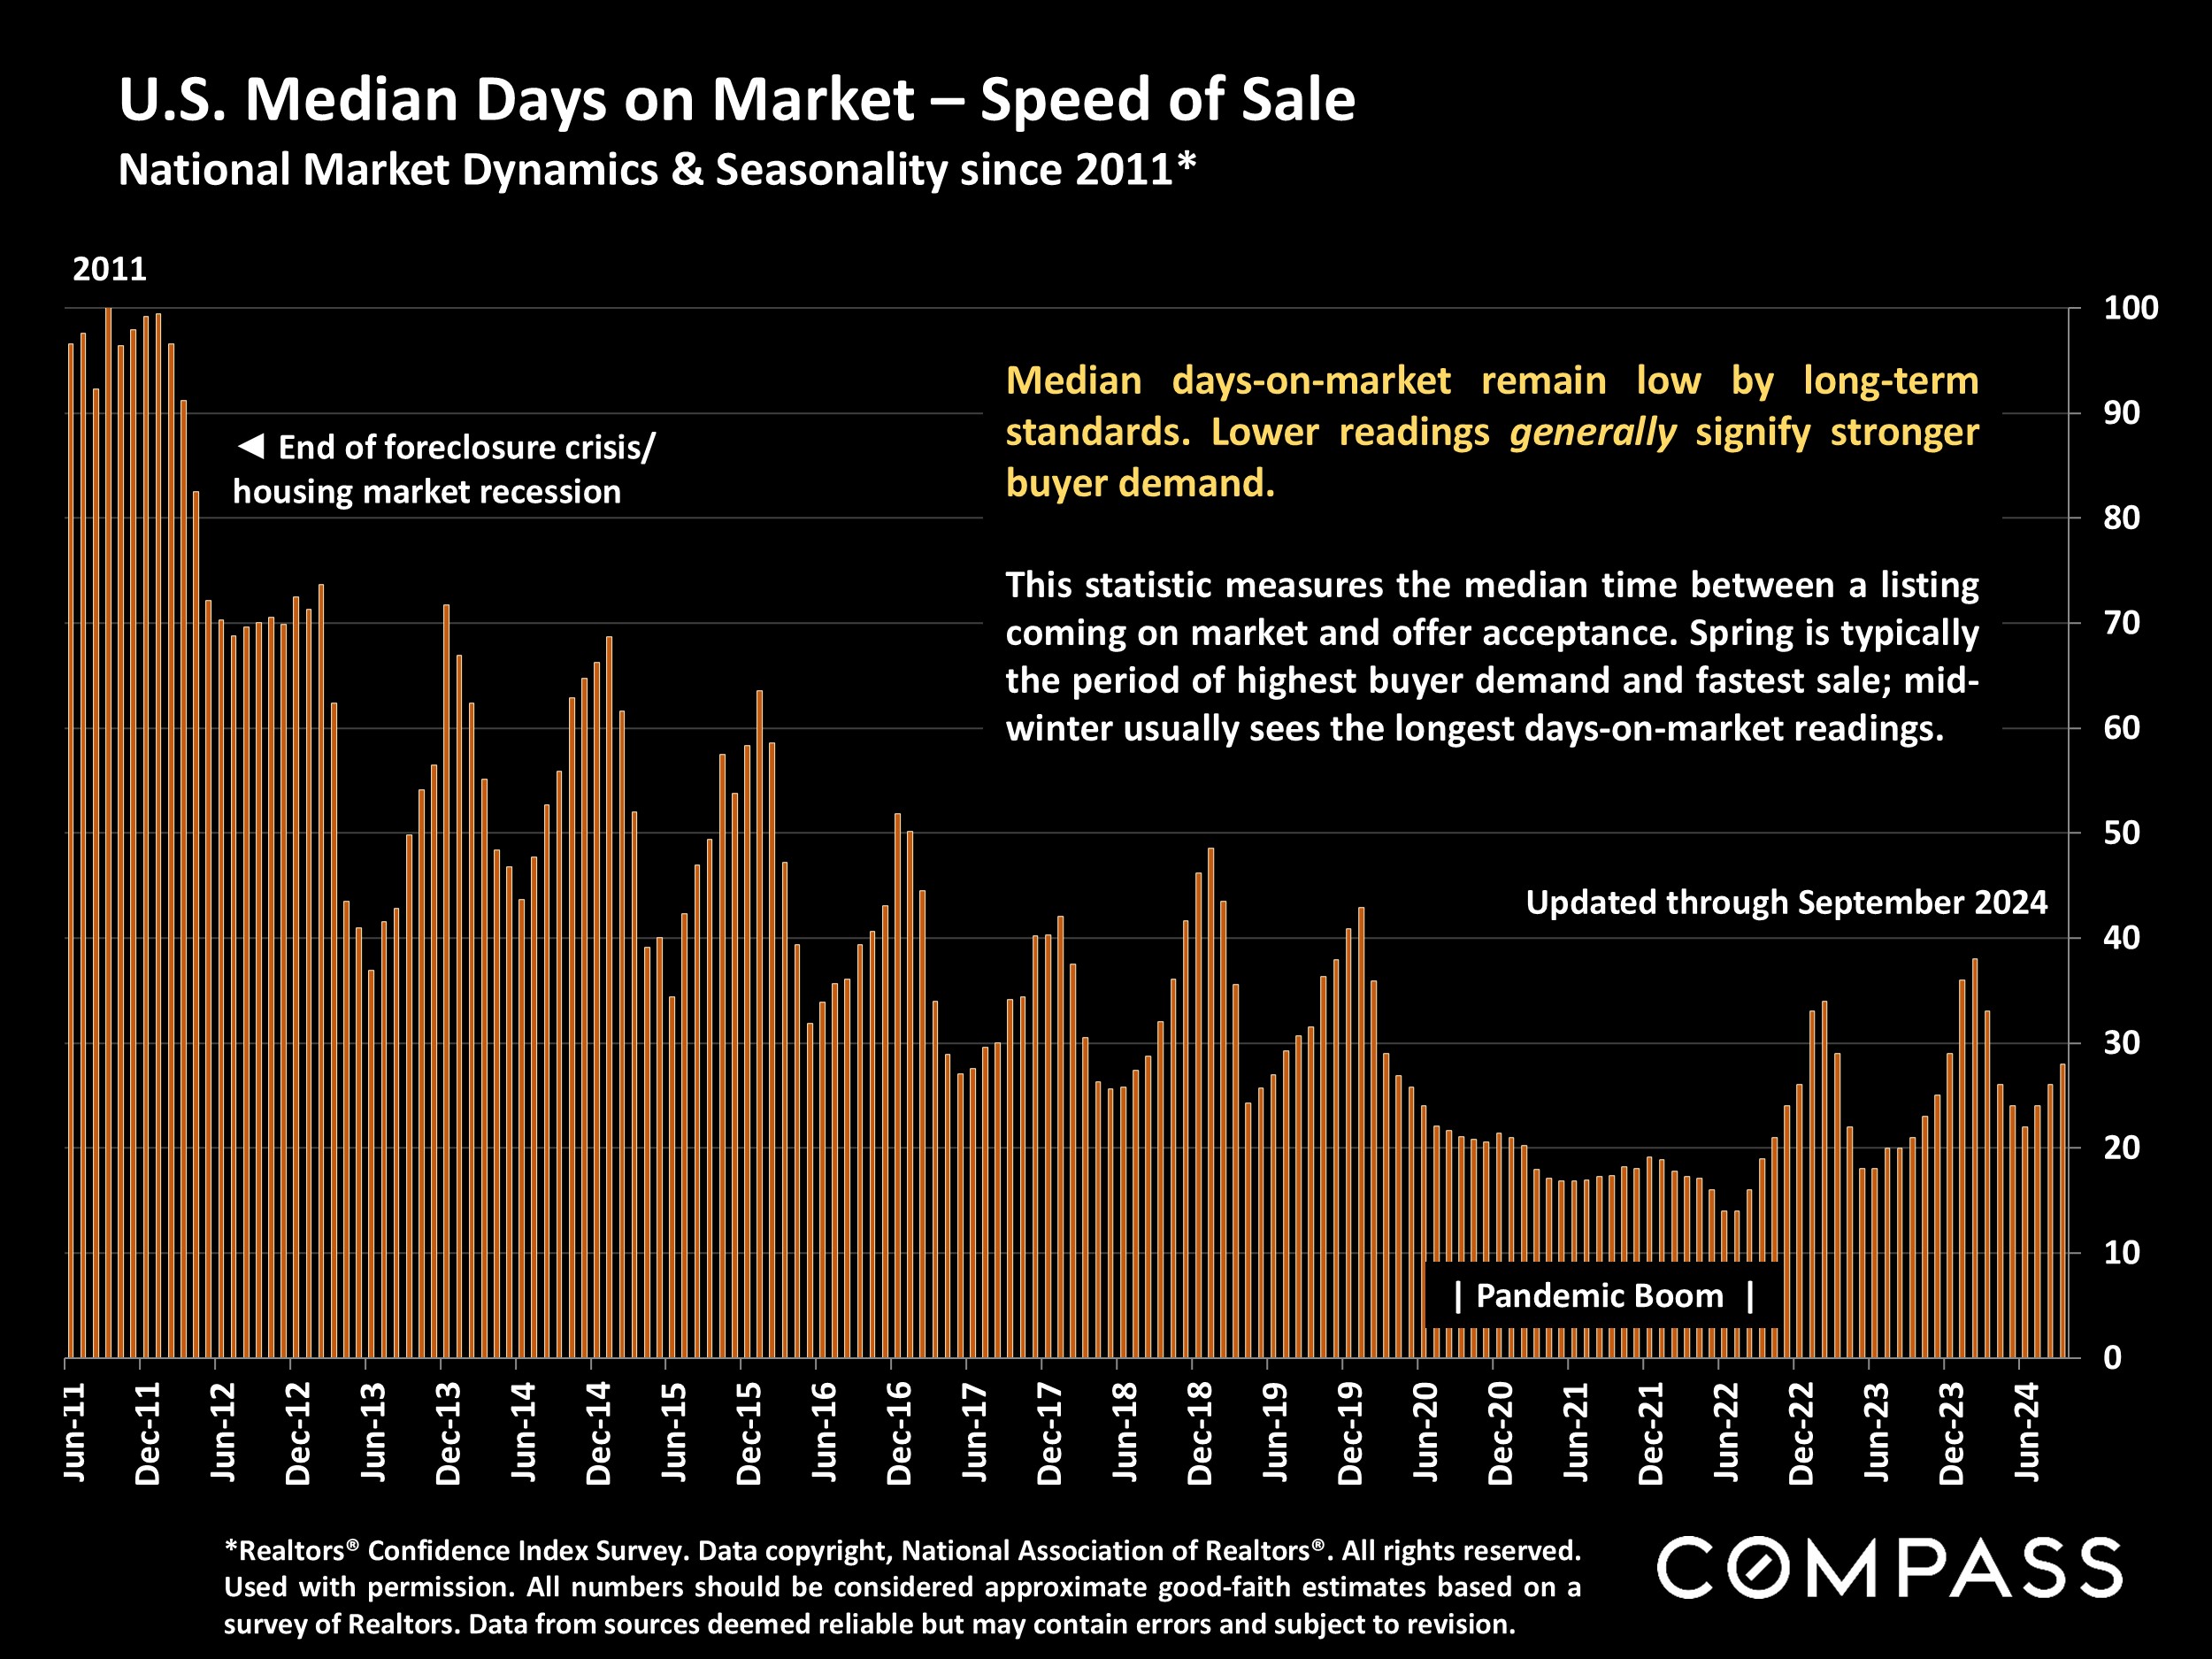
Homes typically sell quickest in spring, with days-on-market increasing gradually to peak in mid-winter. The median time between coming on market and acceptance of offer has been climbing, but remains low by pre-pandemic standards. |
|
|
A snapshot of home sales prices across the country. What one gets for one's money varies enormously by state, city, town and neighborhood: The same price can buy a fixer-upper or a luxury home depending on location. |
|
|
A growing crisis has been the difficulty - especially pronounced in certain states - in finding comprehensive homeowner's insurance at an affordable cost from a reputable insurer. |
|
|
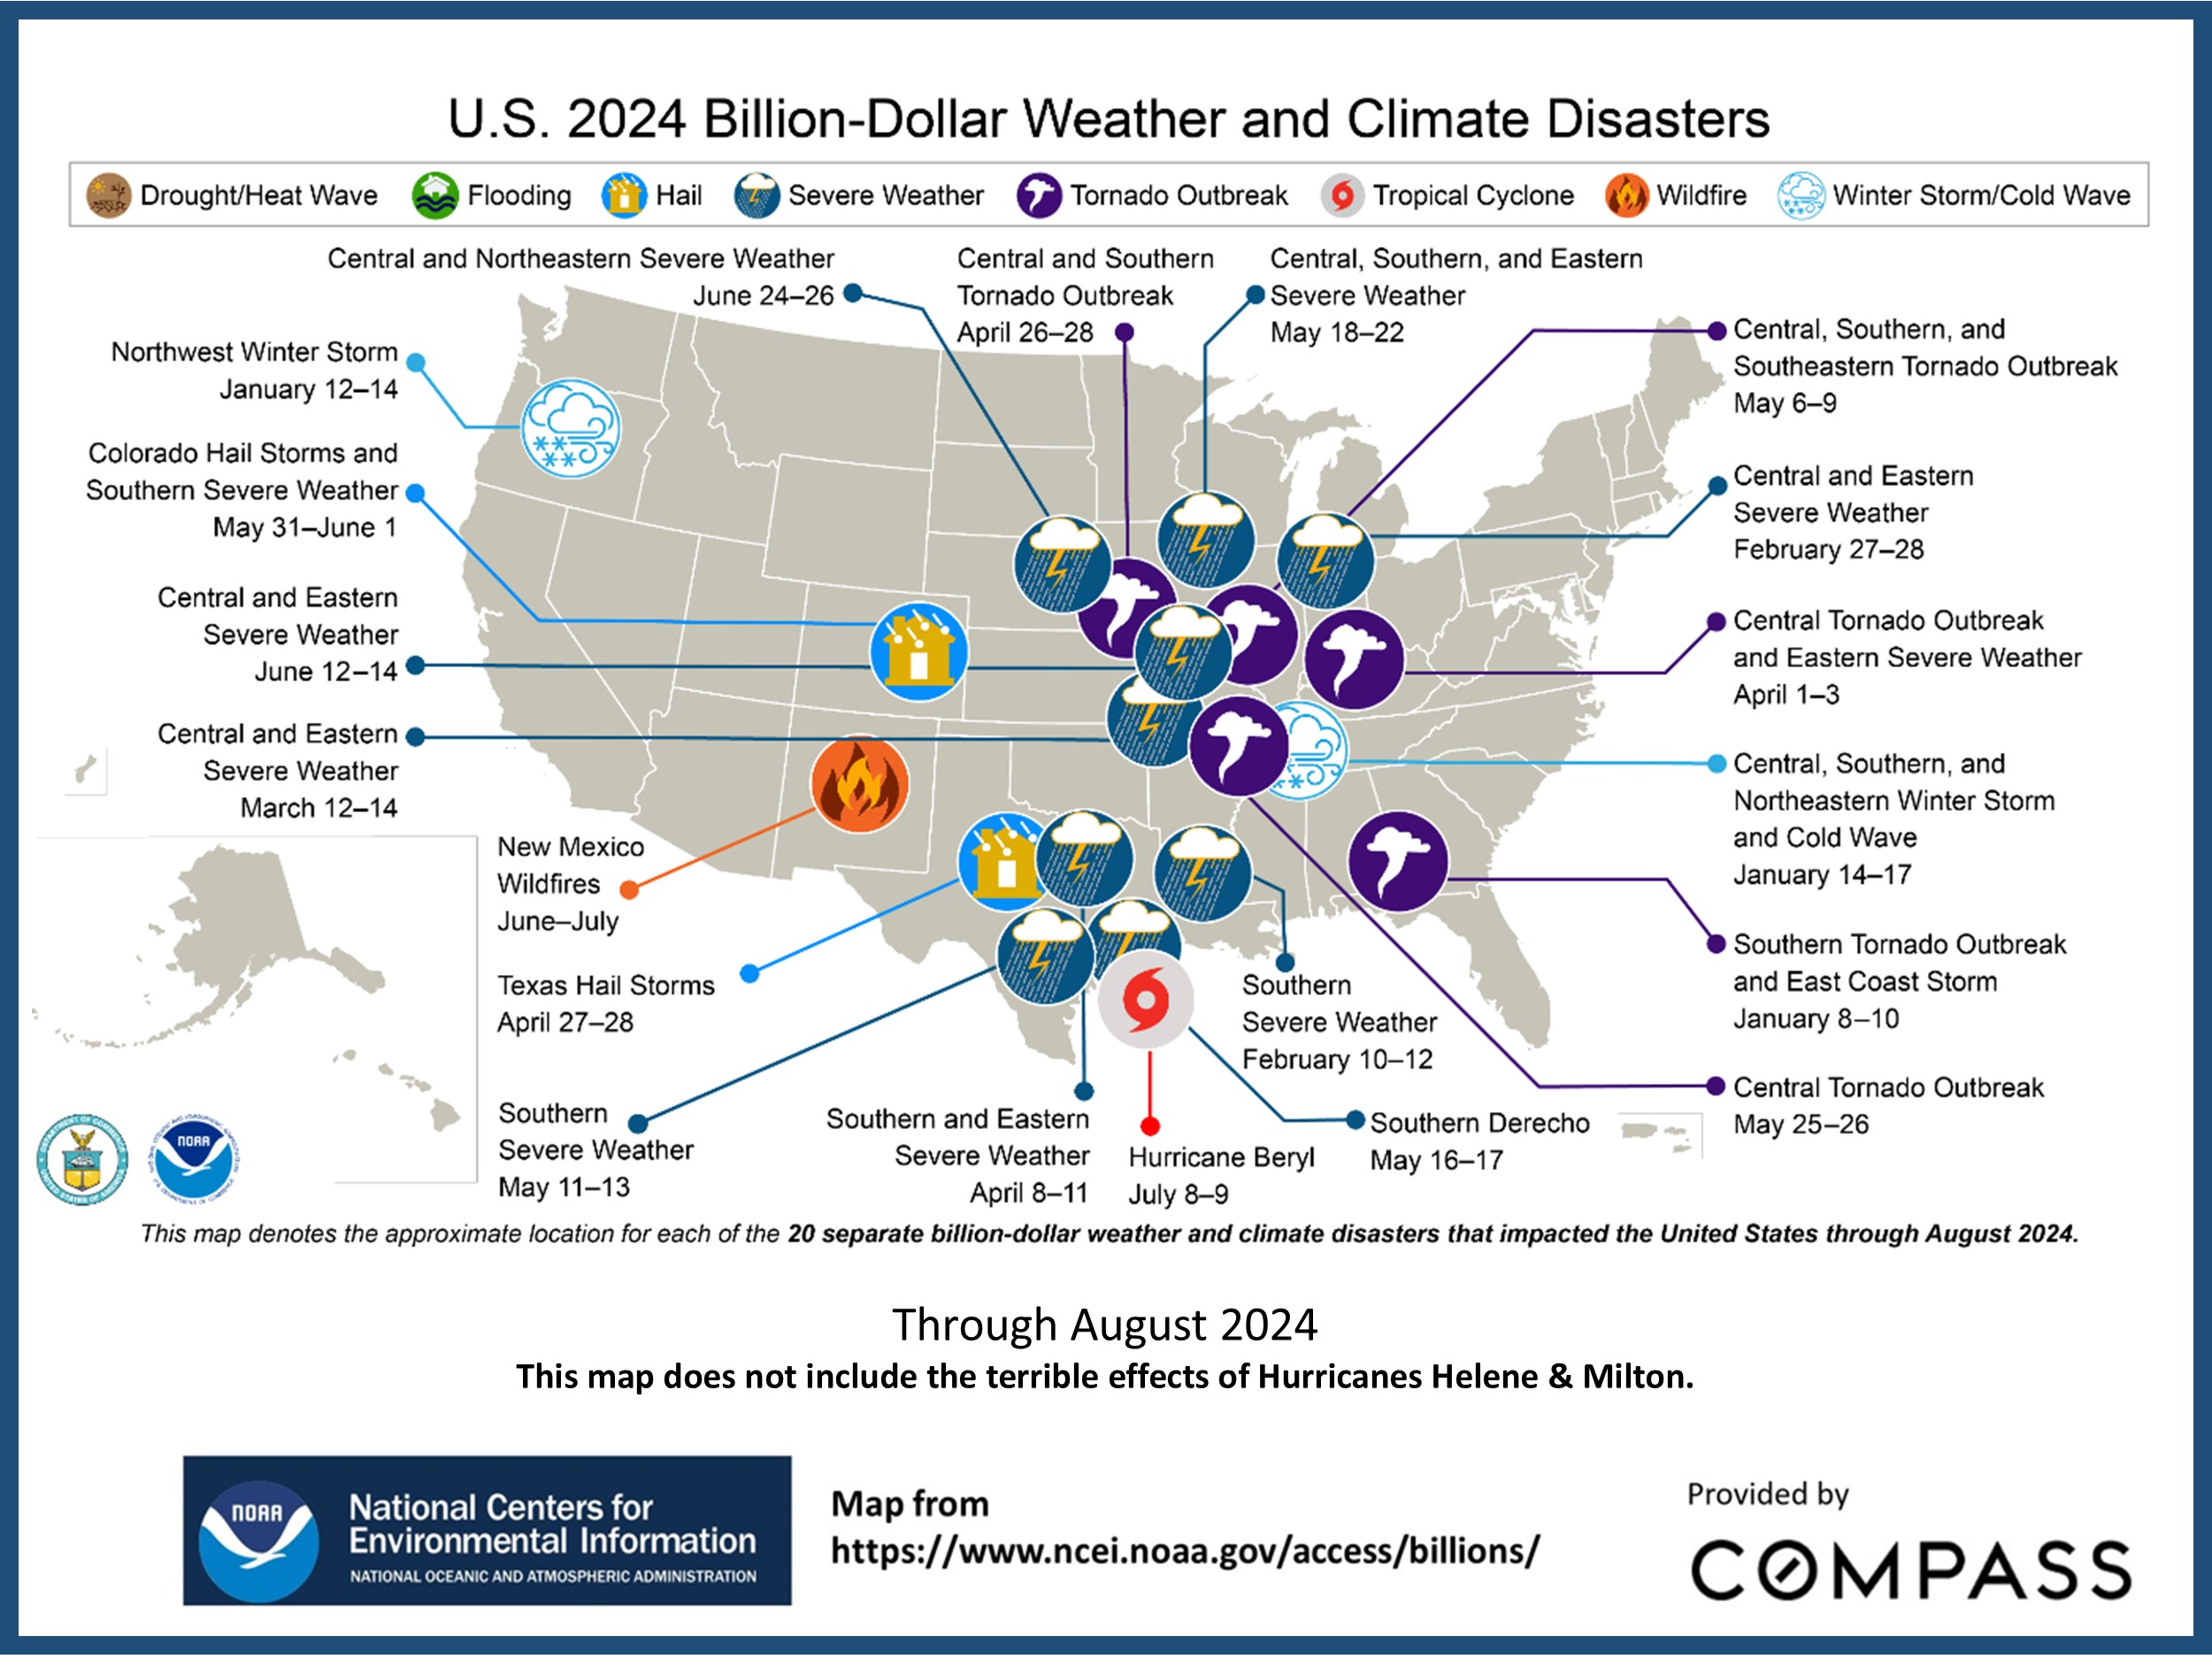
Behind the increase in insurance rates has been the increase in weather disasters, which can hit different regions in different ways in different years. This 2024 YTD map does not yet include the terrible hurricanes of recent months. |
|
|
An illustration of the immense increase in homeowner's equity over time - especially pronounced over the past 4 years. This is due to home price appreciation, an increase in homebuyers paying all cash, and homeowners paying off their mortgages. |
|
|
A comparison of median house sales price appreciation, the appreciation of median household income, and inflation. Since 1984 median household income has outpaced inflation, and median home sales prices have soared above both. |
|
|